
Statewide Antibiograms
2025 Antibiograms
Executive Summary
An antibiogram is a summary report of
antimicrobial susceptibilities of local bacterial
isolates submitted to a microbiology laboratory
over a defined period (usually one year). It shows
the percentage of bacterial pathogens that are
susceptible to various antibiotics and is typically
presented in a table format.
Antibiograms are a critical tool for clinicians,
pharmacists, and infection preventionists. They
help guide empiric antibiotic therapy decisions—
especially before culture results are available—by
providing insight into local resistance patterns.
In addition to informing treatment, antibiograms
also play a key role in antibiotic stewardship by
promoting the selection of narrow-spectrum
agents when appropriate and helping reduce
inappropriate antibiotic use, which can drive
resistance.
Interpreting Antibiograms
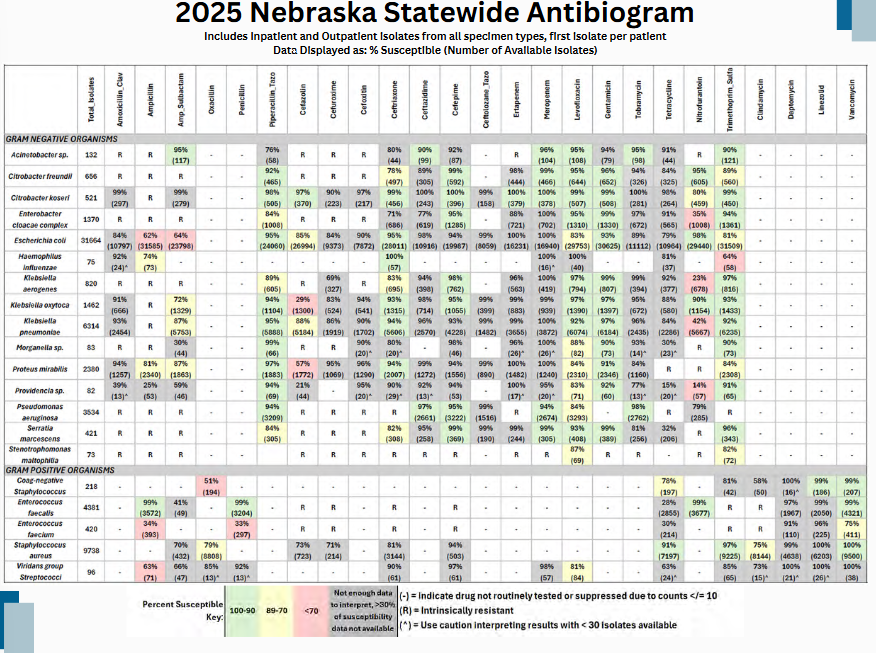
- Antibiogram layout
- Antibiotics are grouped by class and are listed across the top row
- Bacterial isolates are listed horizontally and arranged alphabetically
- The total number of isolates that were included in this report for a specific bacteria are listed in the second column
- The percentage of isolates that are susceptible is listed first, followed by the number of isolates tested for the drug-bug combination
- Note: not all antibiotic susceptibilities are available for all drug-bug combinations
- Spaces with a dash (-) indicate that the drug-bug combination is not routinely tested
- “R” indicates that the bug is intrinsically resistant to the antibiotic
- Antibiogram Interpretation
- Usually, a susceptibility rate over 90% indicates more susceptible options and will be represented by a green highlight.
- On the other hand, susceptibility rate of less than 70% may indicate highly resistant options and are represented by a red highlight
- Review Organism Distribution: Note the total number of isolates mentioned in parenthesis for different bacterial species to understand common pathogens.
- Use caution interpreting susceptibility results:
- With <30 isolates, which is indicated by a ^
- Gray boxes indicate not enough data to interpret as more than 30% of susceptibility data is not available for the drug-bug combination
- Use caution interpreting susceptibility results:
- Interpretation Key:

Disclaimers & Limitations
The data to create the antibiograms found within this
report was retrieved from electronic lab reports submitted
to the Nebraska Electronic Disease Surveillance System
(NEDSS).
The report contains only the first isolate submitted per
patient in 2025 and includes specimens from all locations
(inpatient and outpatient) and all sources (e.g. urine,
respiratory, blood, etc.). Organisms with susceptibility
results from 10 or fewer isolates were excluded.
Please note, some laboratories choose to suppress
certain antibiotic susceptibility results for some
organisms for antibiotic stewardship purposes. Therefore,
not all isolates will have results for all antibiotics
available. For a particular organism, if the number of
isolates tested for a specific drug is much lower than the
total isolates tested for other drugs, the results may not
be reflecting the true susceptibility pattern and may
overcall resistance or susceptibility.
Data are the result of single microorganism-antimicrobial
combinations and, therefore, do not show trends in cross-
resistance of microorganisms to other drugs (multi-drug
resistance), nor do they reveal synergistic properties of
antimicrobials used in combination.
Additional limitations of antibiograms include potential
sampling biases, incomplete data extraction, and variations
in data collection and interpretation methodologies across
different institutions.


